Most of the comments I get on this site have to do with someone trying something I’ve written about that isn’t working for them. In most cases, error messages can be your friends since they can point to the particular place your script failed and give you additional insight into why it failed.
This post will describe some of the ways you can use the built-in tools of the Google Apps Script environment to debug or troubleshoot your own scripts. My goal here is start from the easiest to implement and work towards more difficult, but more efficient, methods of debugging.
Starting with the Code
Before we get into all of the methods of getting information from Google Apps Script, let’s look at the script we’ll be using to illustrate some of these concepts.
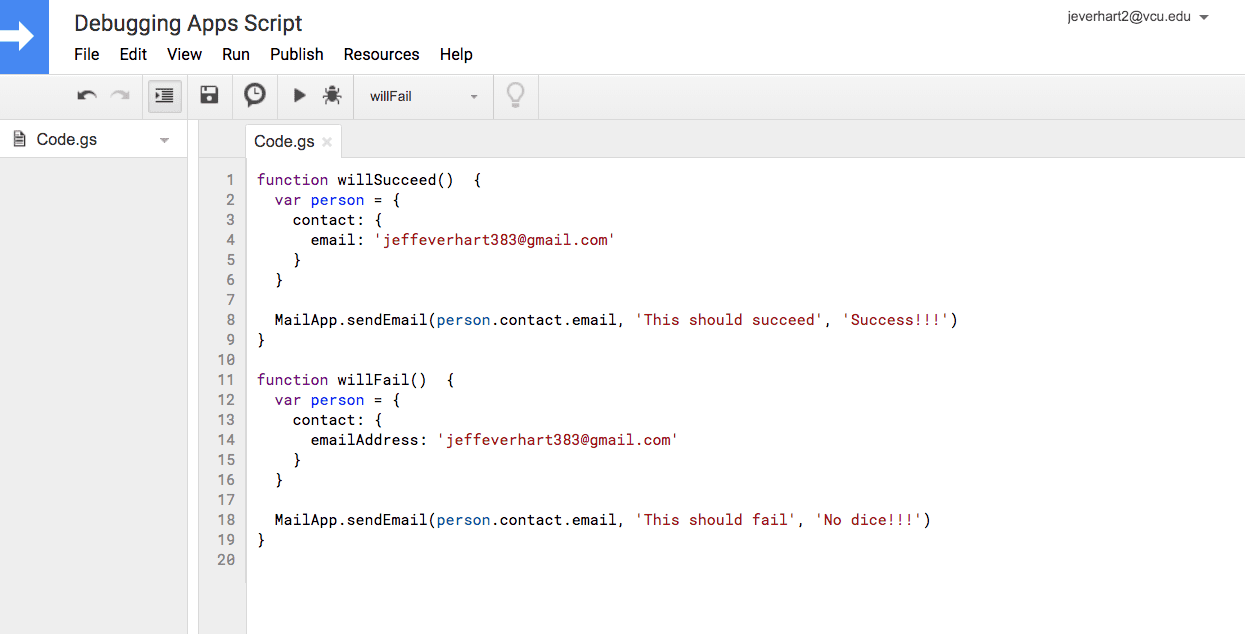
Here we have two functions, aptly named willSucceed and willFail with basically the same code inside of them. Each function declares a variable called person with some different properties containing an email address, and then we attempt to read from that object when we send an email using MailApp.sendEmail at the end of the script.
If you look closely at both functions, you will see that when we try to reference the email address to send the email, we look up the person.contact.email property, but that property does not exist in our willFail example. In this case, when we try to manually run the willFail function from the Apps Script editor, we get an error message indicating that undefined is an invalid email.

When running code manually in the Apps Script editor, we will typically get short error messages like this displayed to us. However, most of the functionality that I write about is not manually triggered in the Apps Script editor, so we need to look at other ways we can get this useful information when our scripts fail.
Creating Failure Notifications with Triggers
A lot of the scripts that I write or document on my site have some sort of trigger-based execution, whether it’s a script that runs every hour or a script that triggers when someone submits a form. These types of scripts can be the hardest to debug since we are often doing other things while they silently execute in the background.
One of the easiest ways to deal with this is to set up immediate notifications from Google when the script fails. This is a simple process that we can achieve in the regular flow of adding any type of trigger.
To add a trigger, you’ll first open the ‘Edit’ menu, and then click the “Current Project’s Triggers” option.
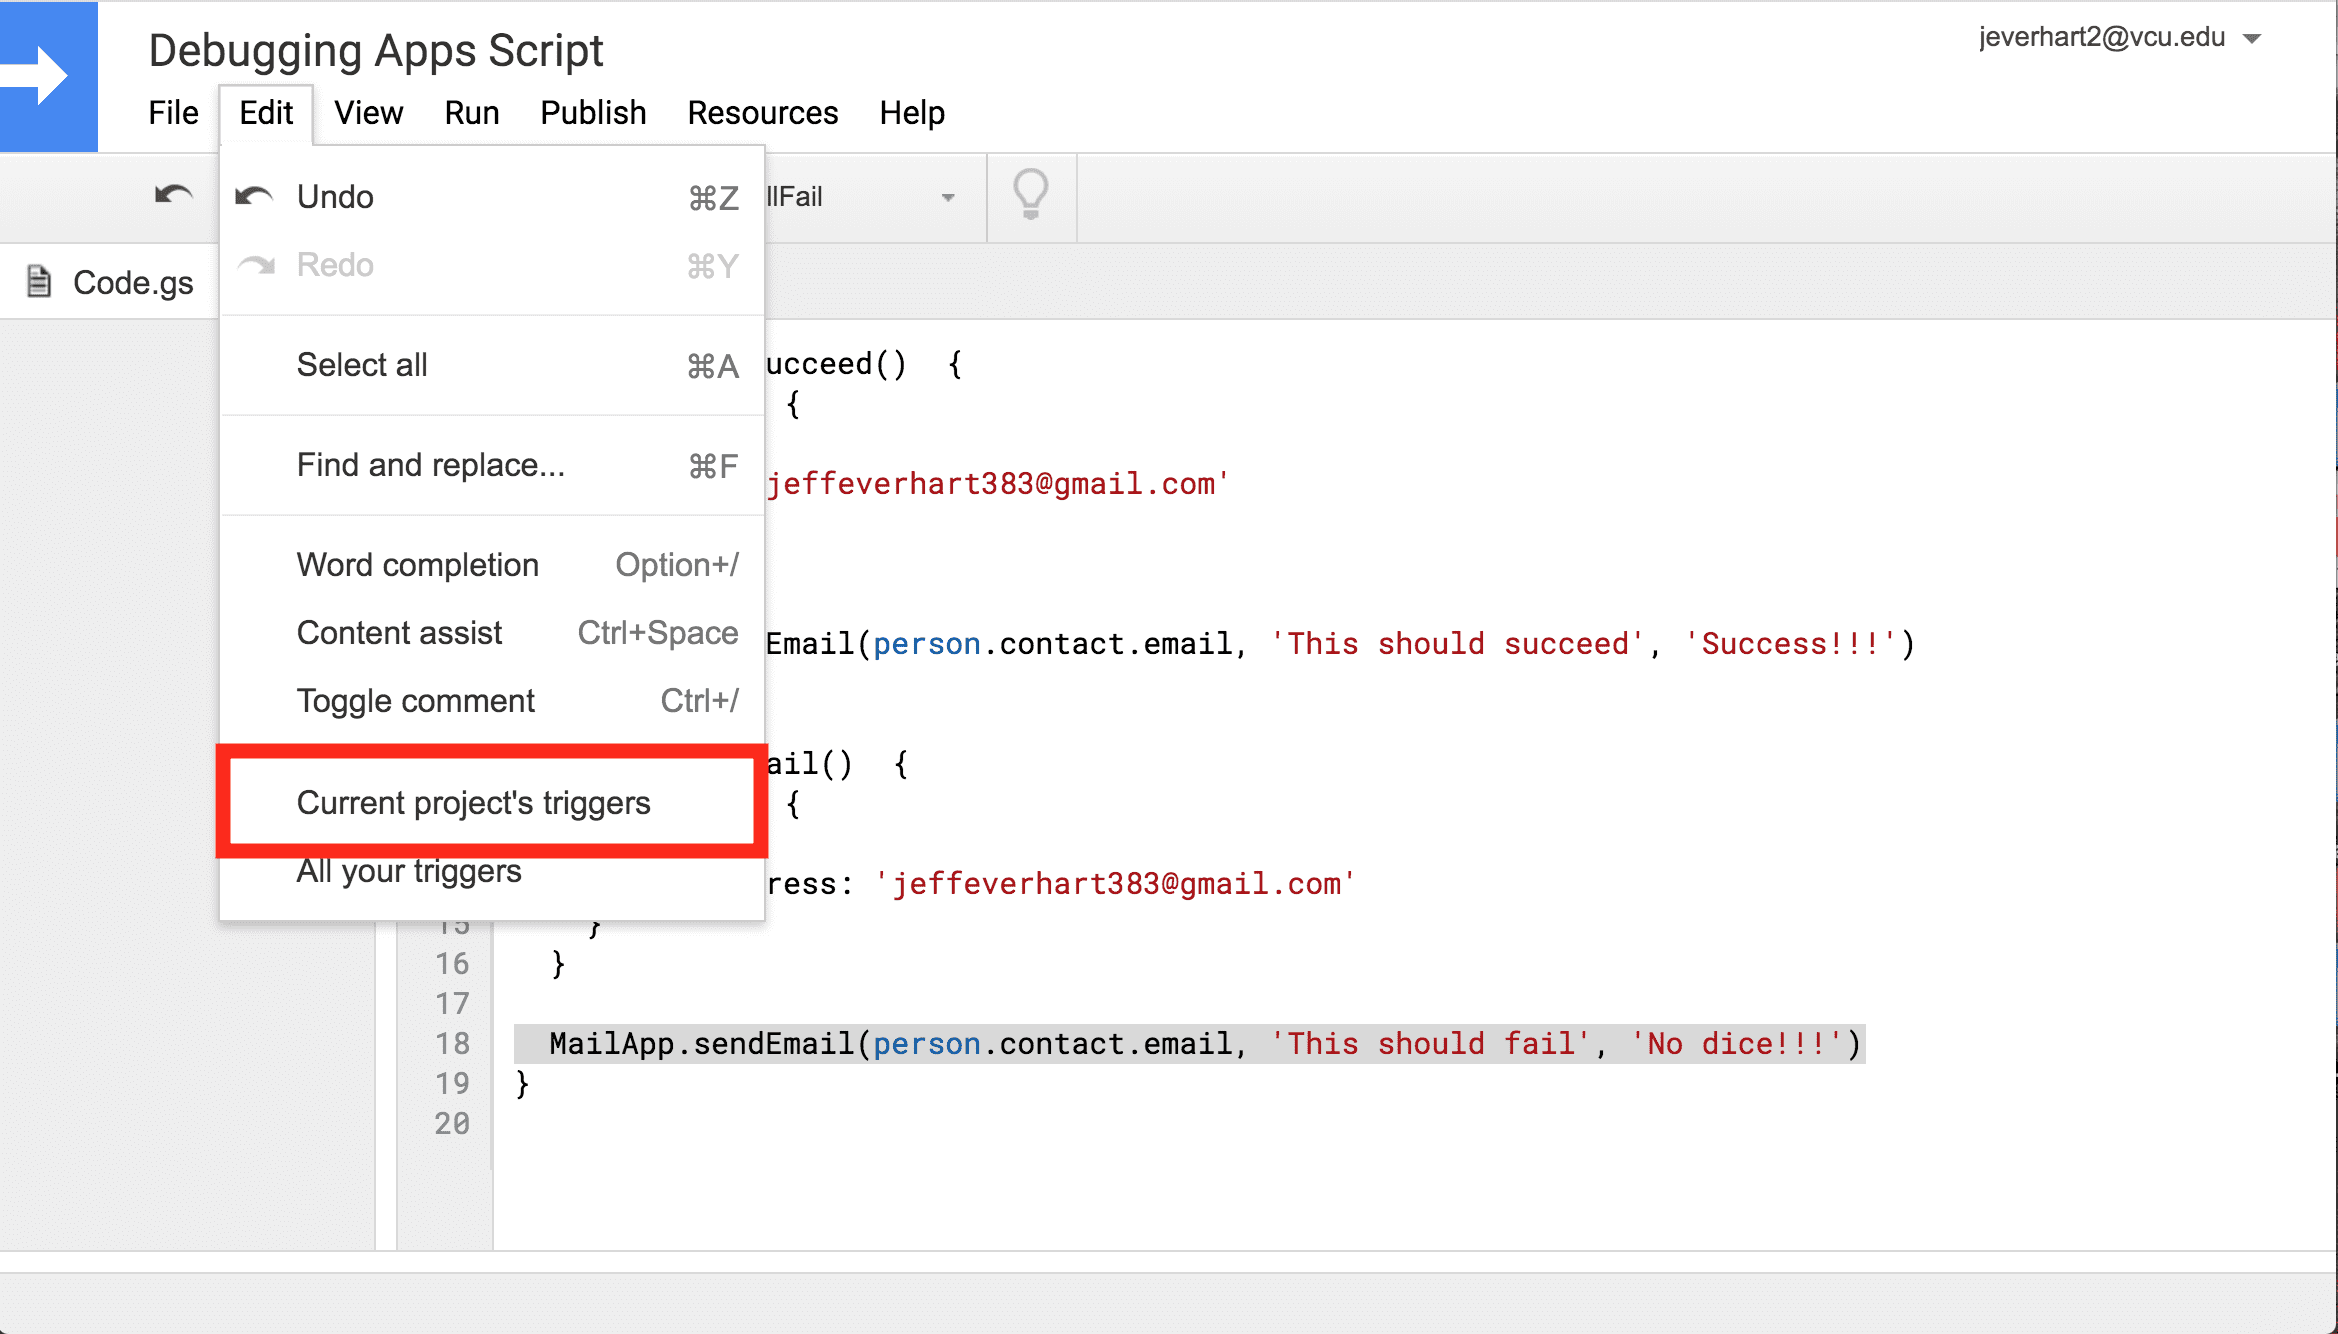
After we click that menu option, we are taken to the Google Apps Script dashboard for that particular project. If the project has no current triggers, you can set on using the button in the bottom right corner.
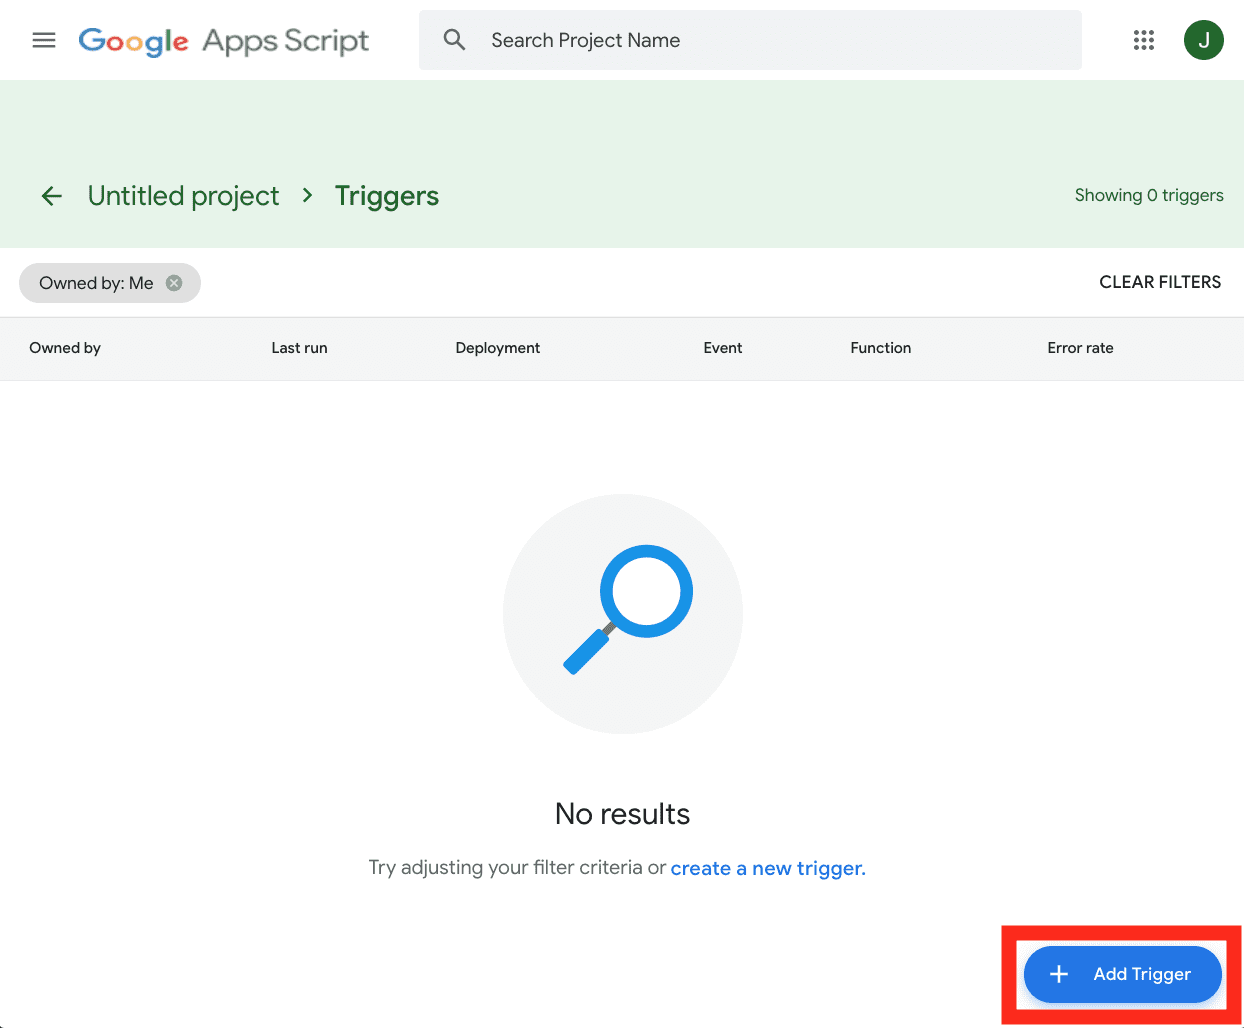
Clicking that button should open a modal that allows you to configure a number of options about the trigger, the function it executes, and how Google Apps Script will handle error notifications. In this example, if you open up the ‘Failure Notification Settings’ menu, we get several options. While creating the script and during its initial deployment, I would recommend selecting ‘Notify me immediately’ for this setting.
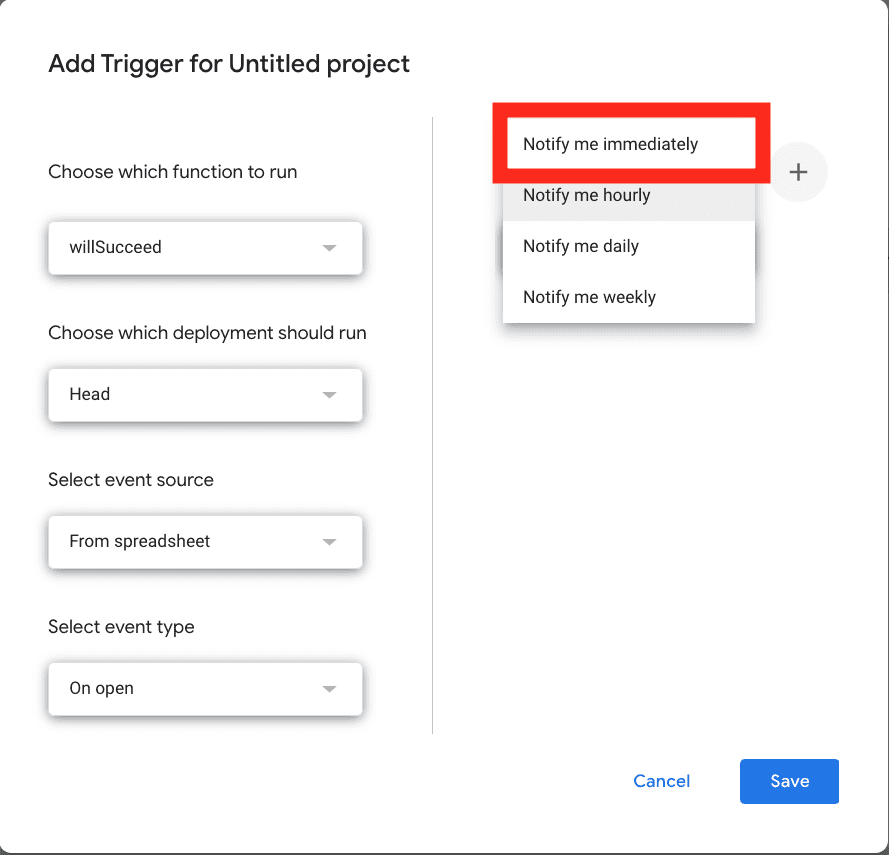
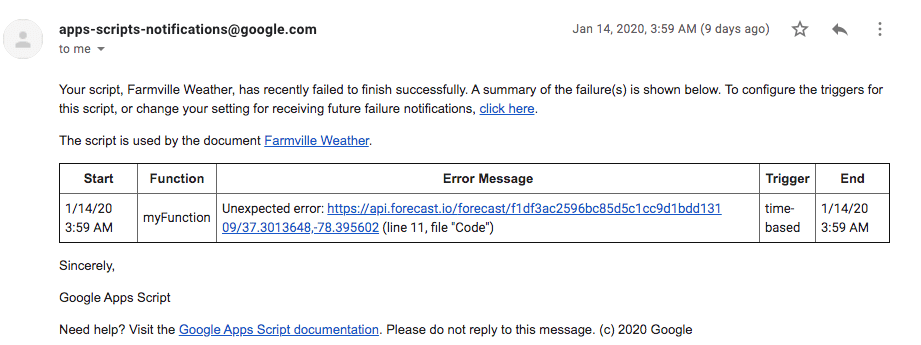
Immediate notifications ensure that you get timely information should your script fail when it is triggered. This is extremely helpful when developing scripts for the first time. When a script fails following a specific trigger, you’ll get an email notification to the email account that owns the script that looks like the following message from one of my many running scripts:
Using Stackdriver Logs to View Errors and Executions
In addition to the trigger-based error notifications I talked about above, there is a monitoring dashboard integrated with Google App Script called Stackdriver. Using Stackdriver you can gain a lot of insight into the executions of your scripts, both successful executions and ones that cause errors.
You can access the Stackdriver panel using the Google Apps Script code editor by using the ‘View’ menu:
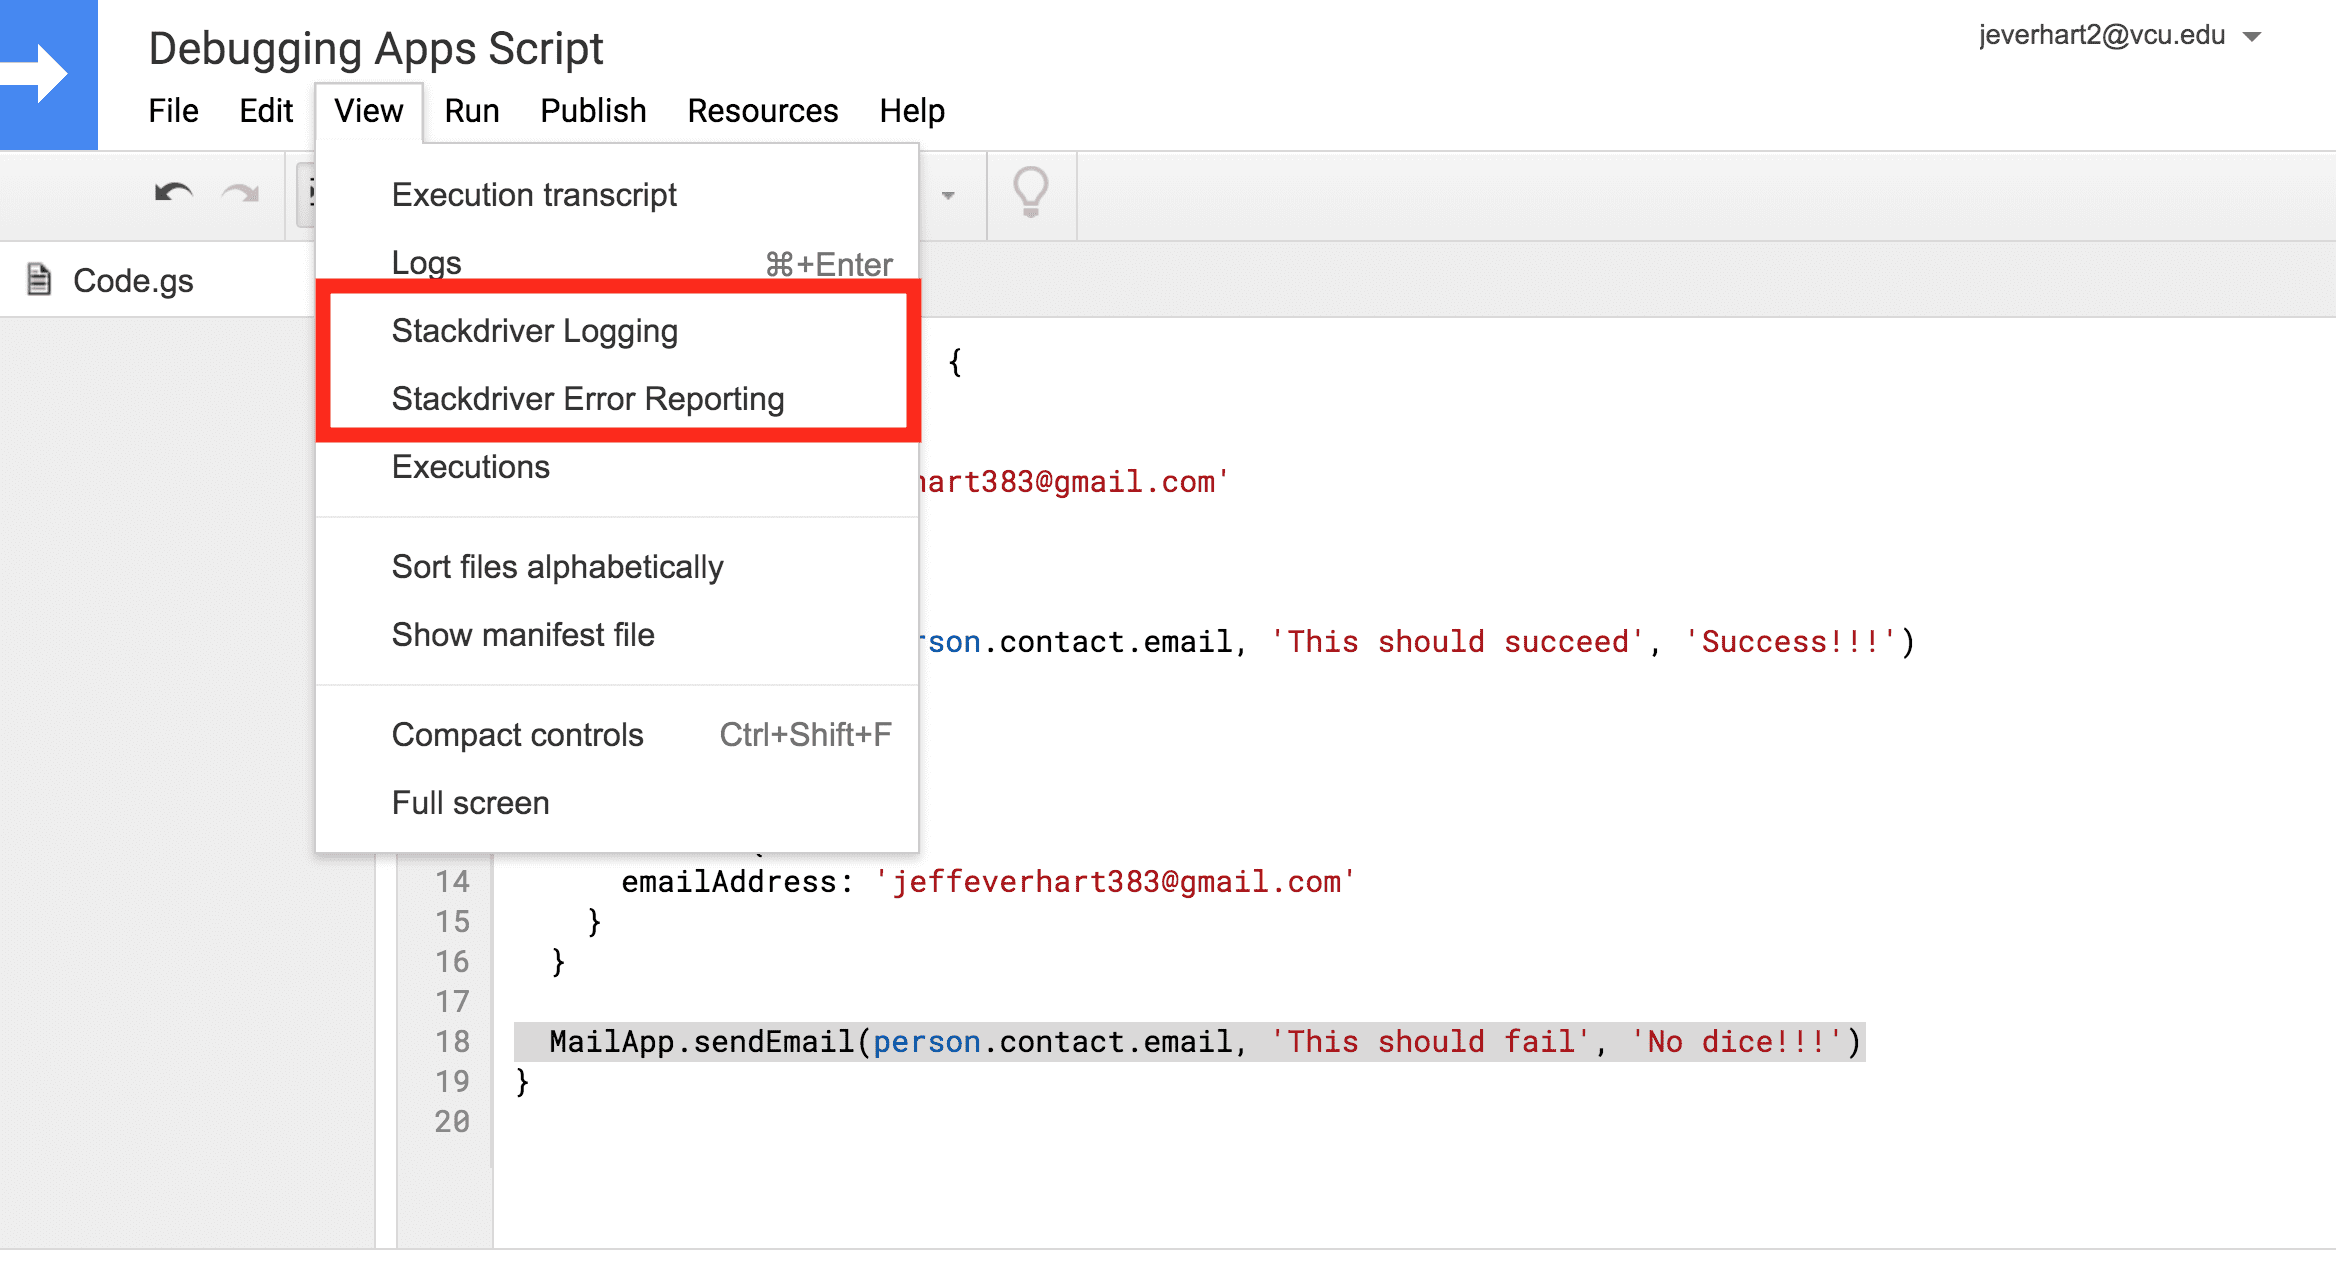
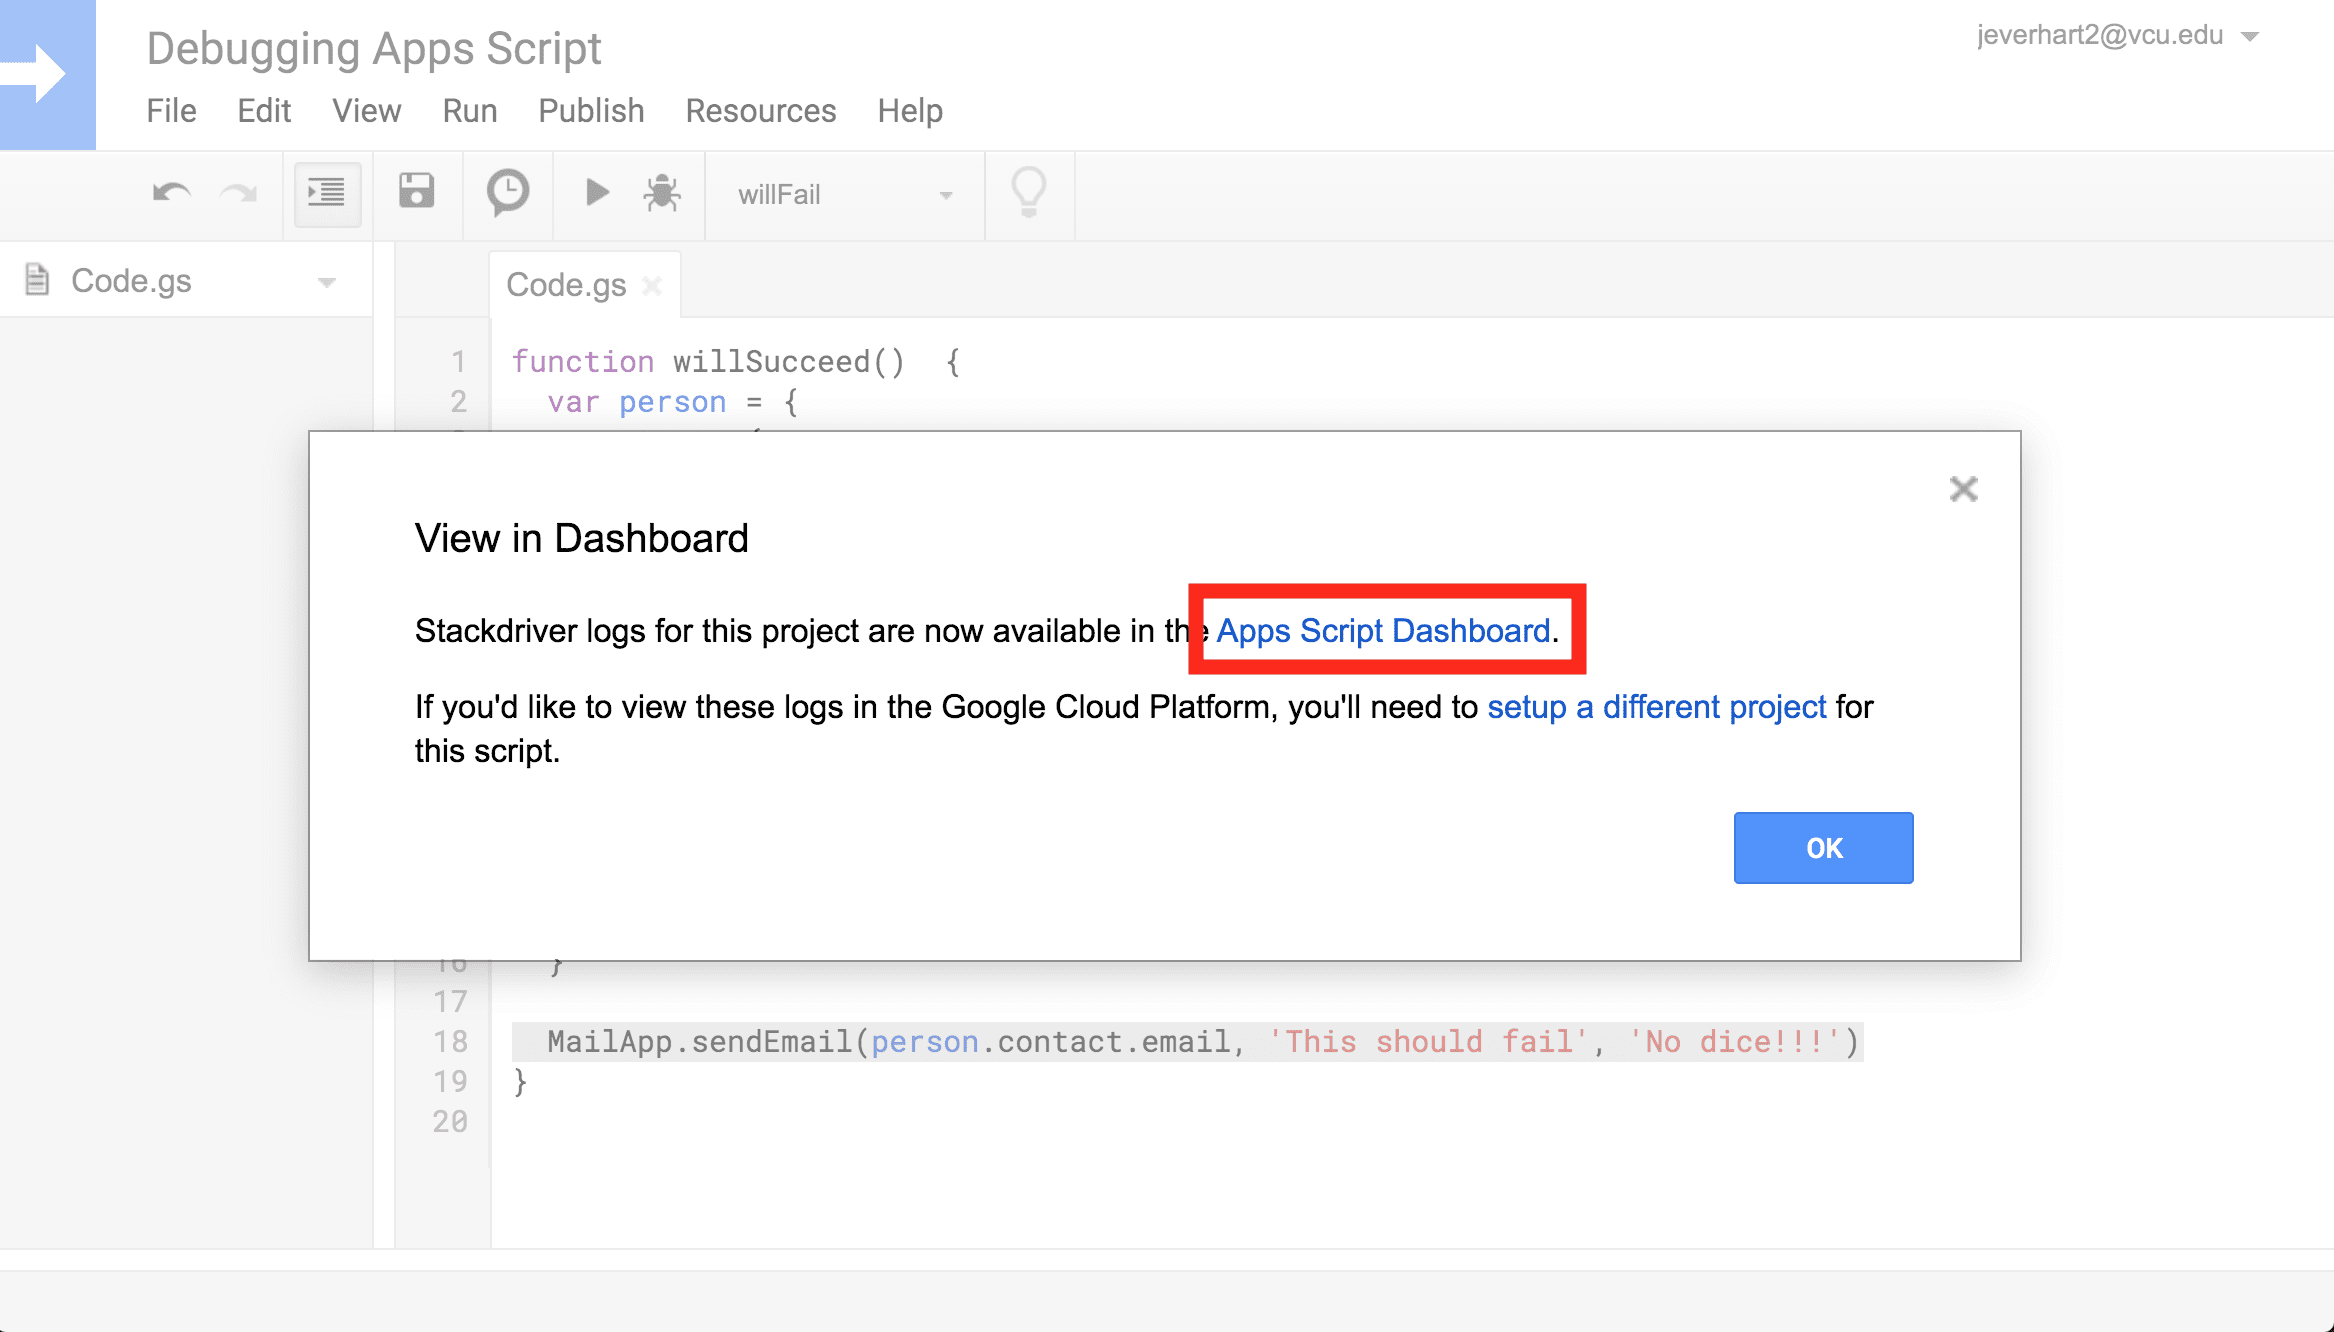
When you select one of the Stackdriver logging options, you’ll get a modal that gives you some options to access it. When this modal is presented, clicking Ok will actually just close the modal. To open Stackdriver from the Google Apps Script console, click the ‘Apps Script Dashboard’ link to open the dashboard.
The Stackdriver dashboard shows a lot of useful information about each execution of your script, including when it was executed, how long it took, and whether or not it was successful. To get more information about each execution, you can click to expand each row of the table.
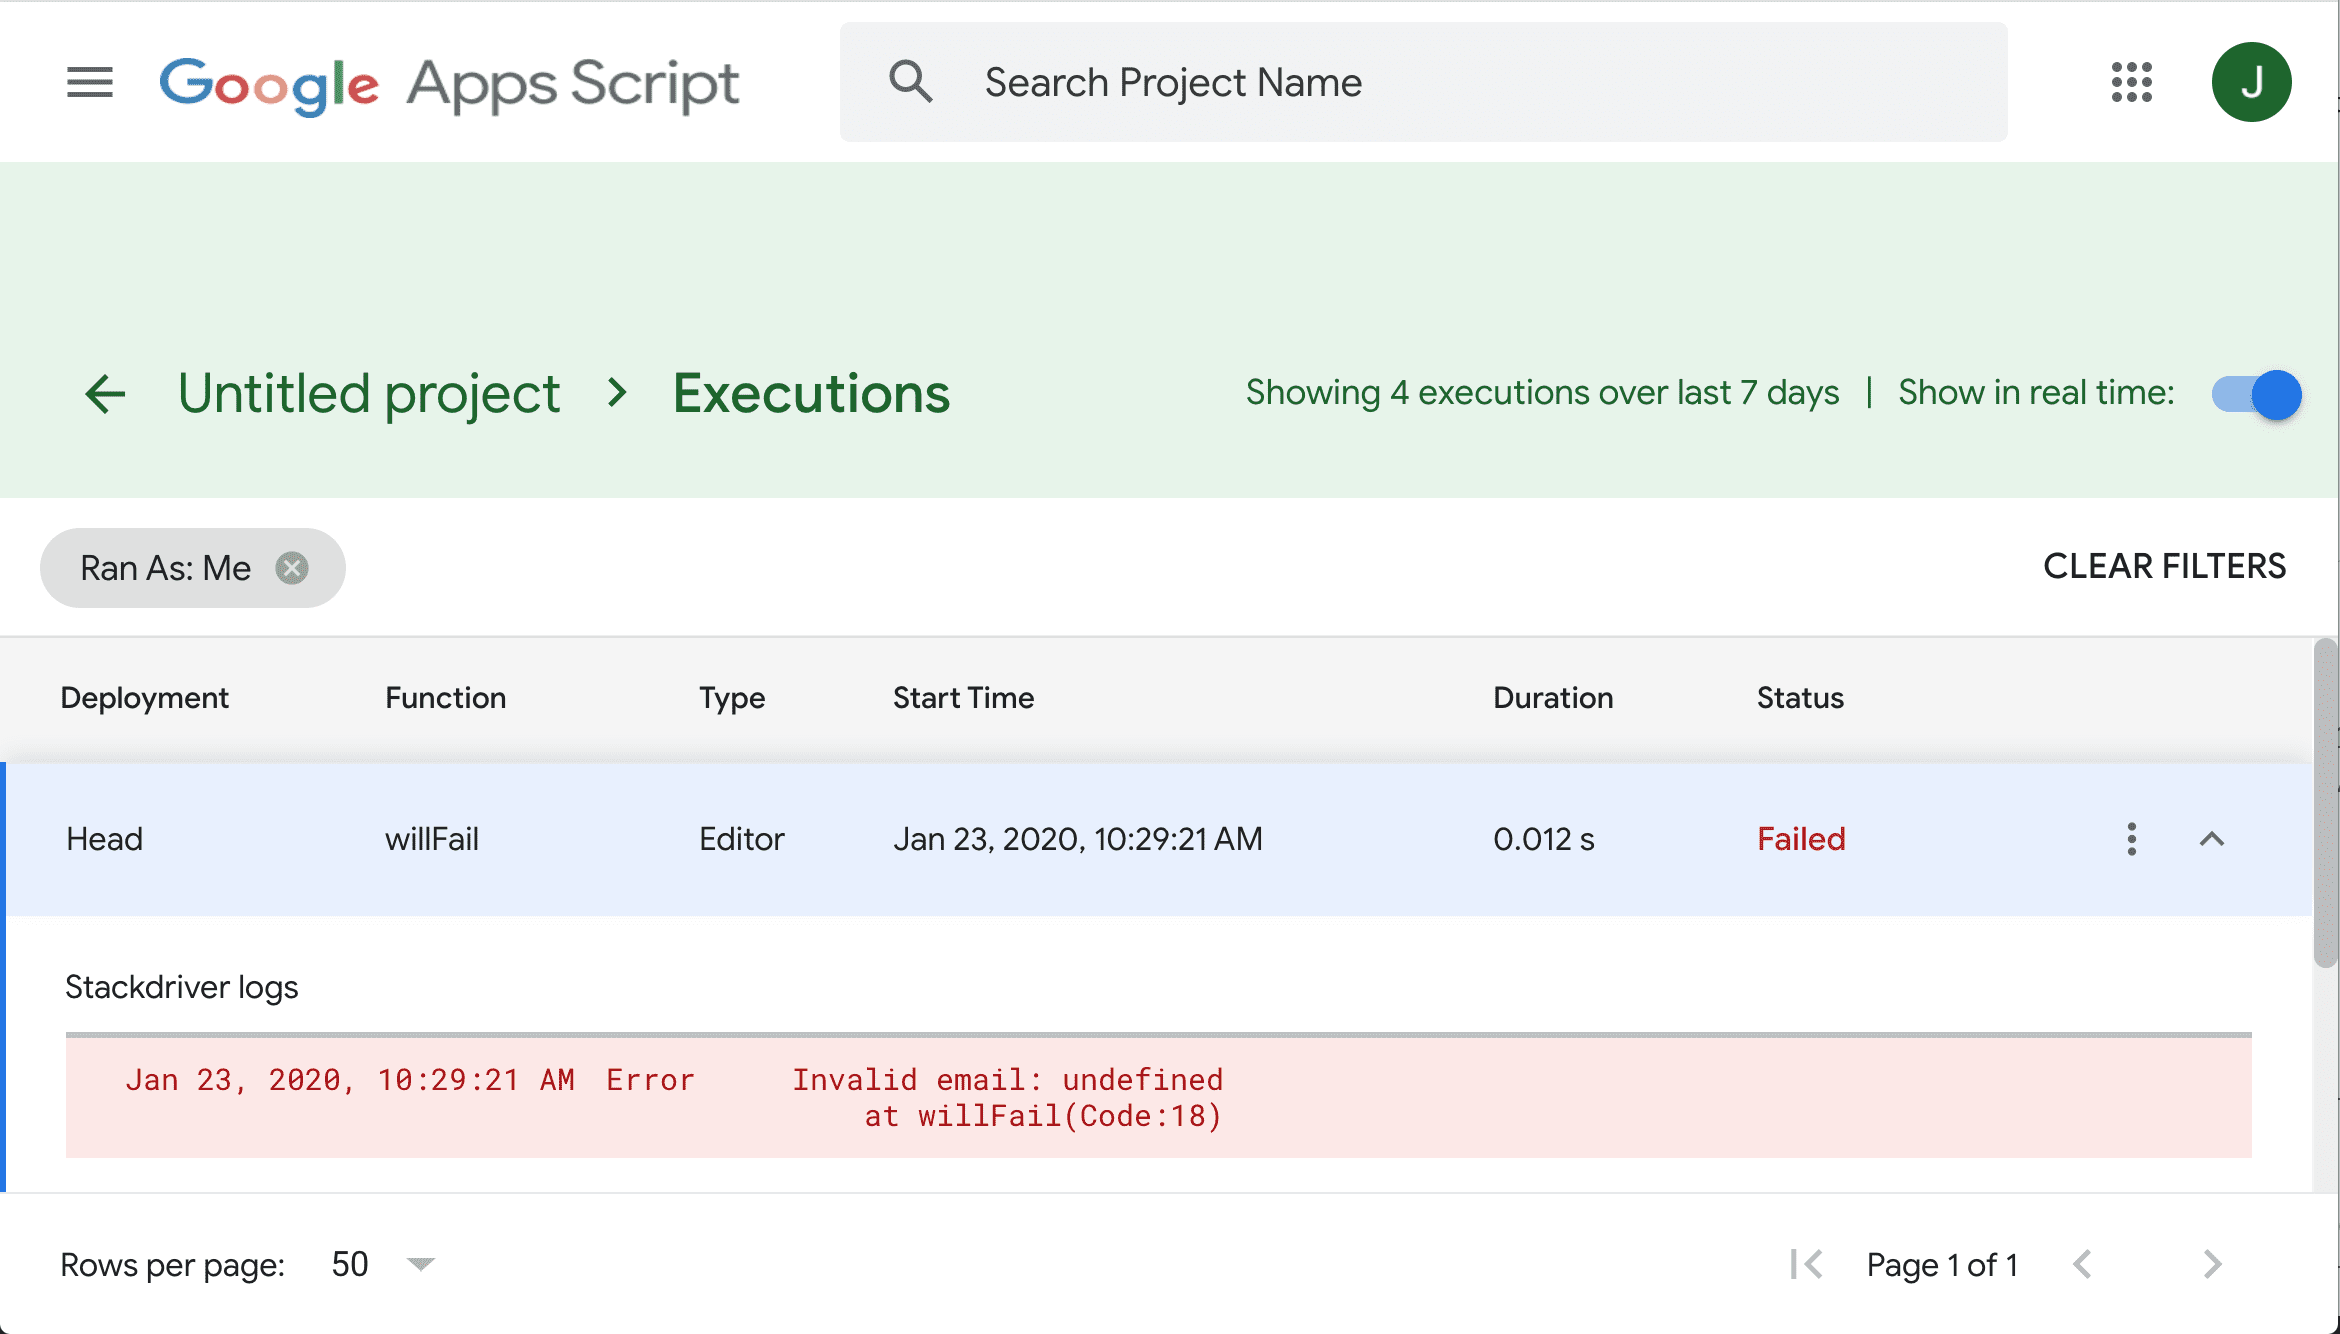
In this example, we can see that the execution clearly failed, and we have some nicely formatted data that explains the error that caused the script to fail. In reality, this doesn’t provide a ton more information for us to work with than the other methods we’ve looked at, but Stackdriver clearly has additional utility beyond just looking up error messages. If executions are taking too long or being skipped, this is a great place to start digging.
Gaining Visibility into the Code
By now we have at least a few methods that should get us to an error message with some additional details. While the error message won’t give us everything we need to address the problem, it should at the very least point us to the line that generated the error and give us some insight into the nature of the failure: was a value not present or invalid, did the script expect and integer and get a string?
From here, we need to dig into the code a little bit more to figure out what is going on. In some cases, this reason for the failure will be completely obvious, but in other cases, you may have to do some digging to figure out the source of an error. In this section, we’ll talk about two useful tools to help gain visibility into your scripts.
Manually Log Output using Logger.log
Most programming environments have a method used to log or write data to a console that can be read by the programmer, and Google Apps Script is no different. Here we can take advantage of Logger.log to print some statements to the built in log console in the Google Apps Script editor.
First, we can go ahead and add two lines of logging to your existing willFail function like so:
If an error message states that there is something wrong with a particular piece of data, it’s always a good practice to log out that data to make sure that it is what you expect it to be. To view the output of the logging we need to open the log console using the ‘View’ menu.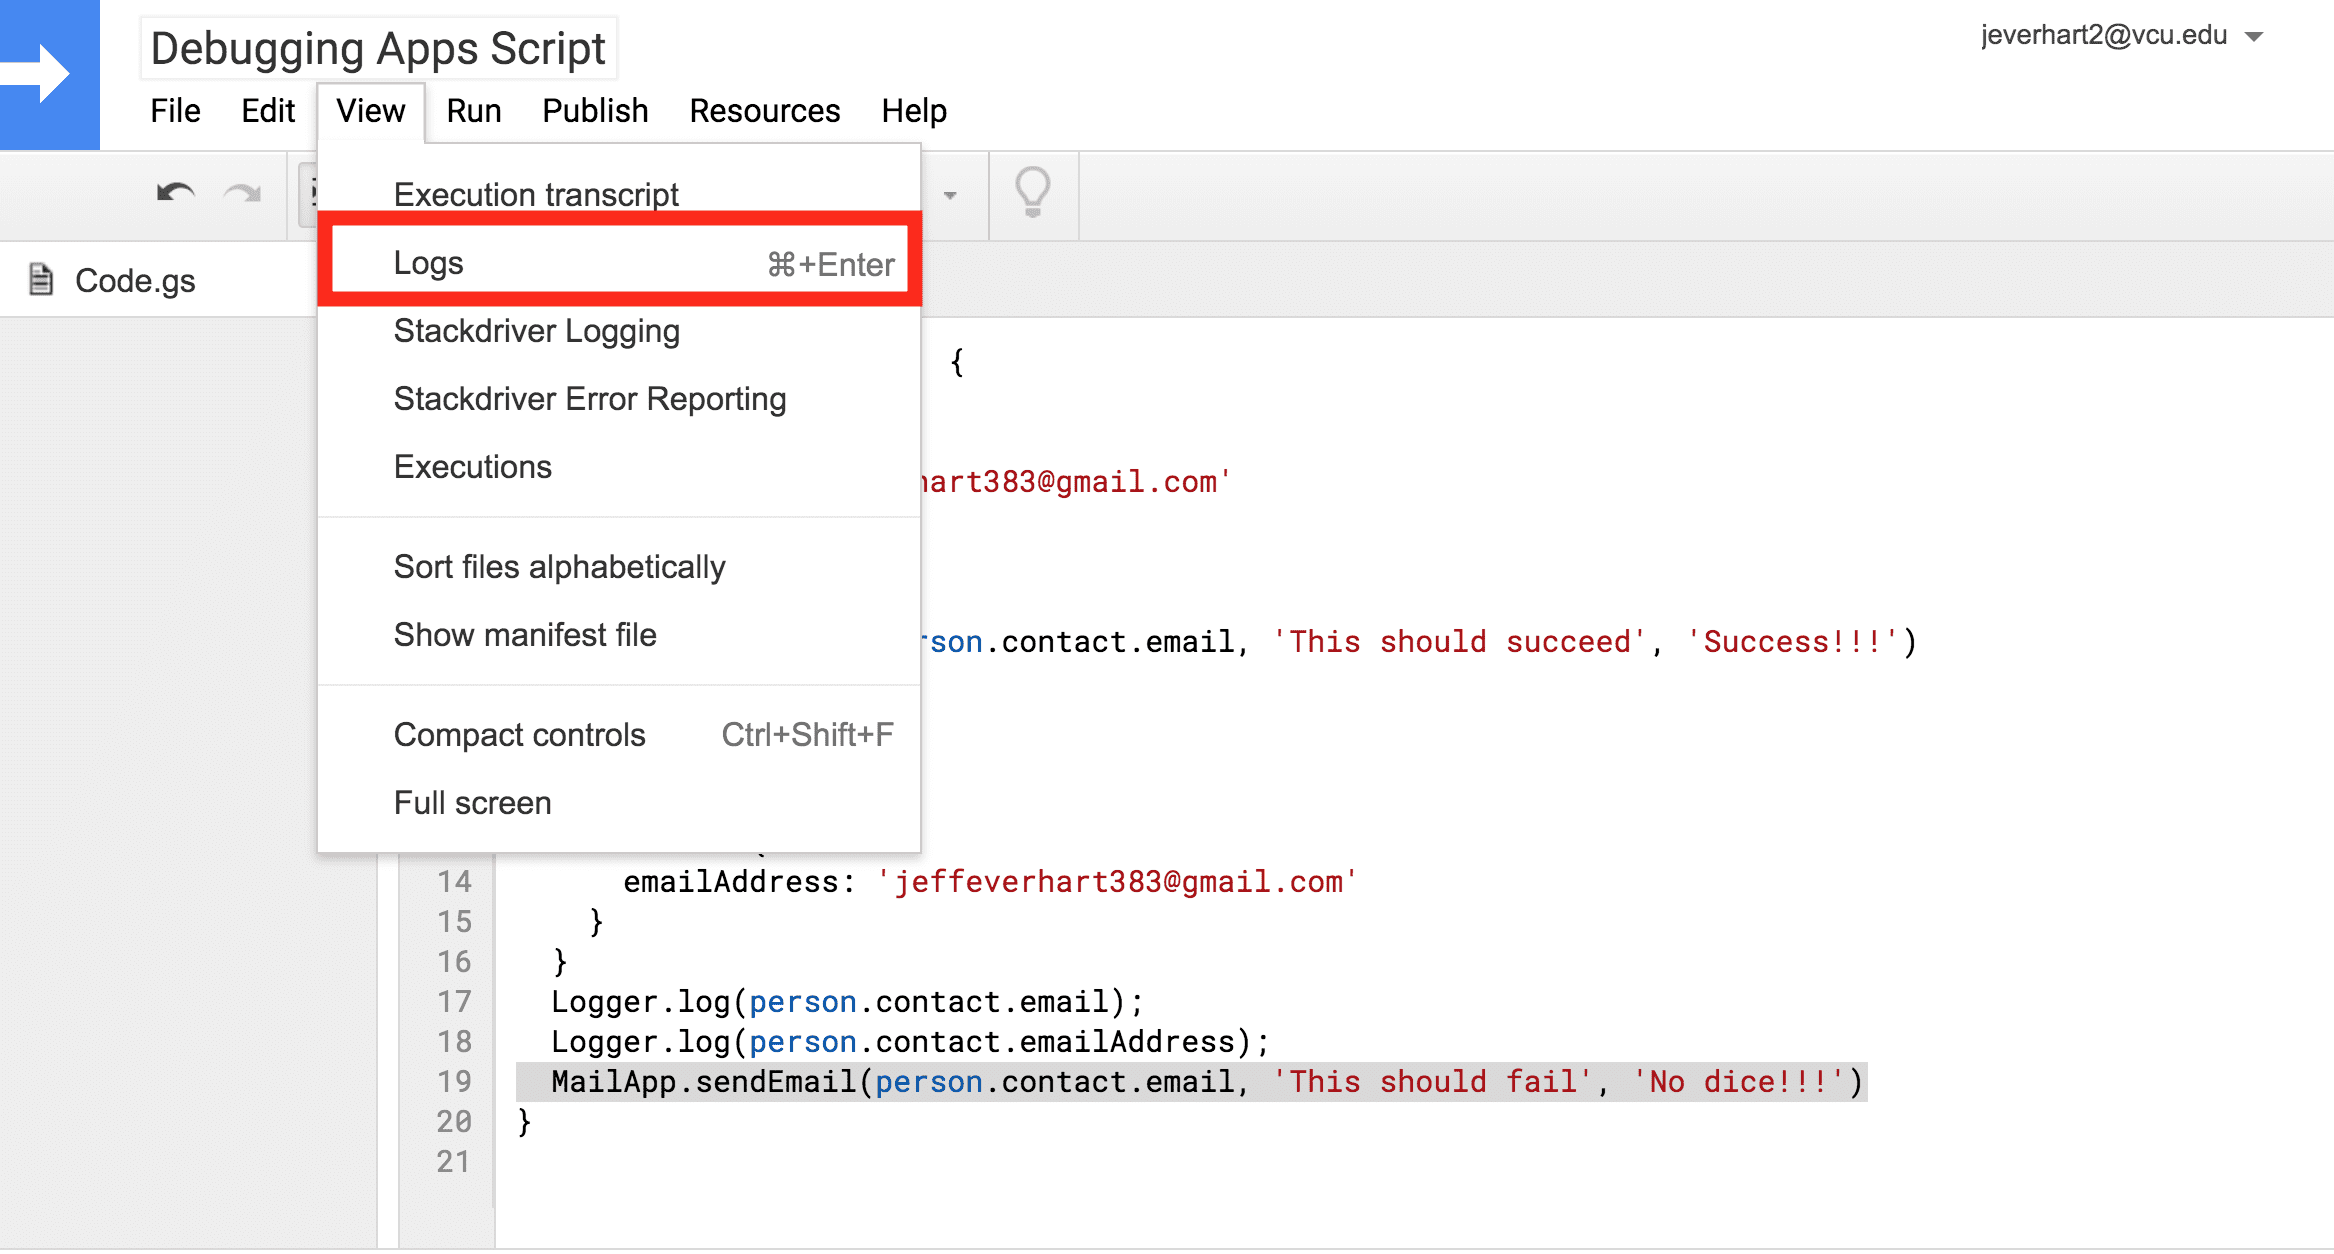
Opening up the logging console produces a modal with the output of the logs themselves, which are also timestamped:
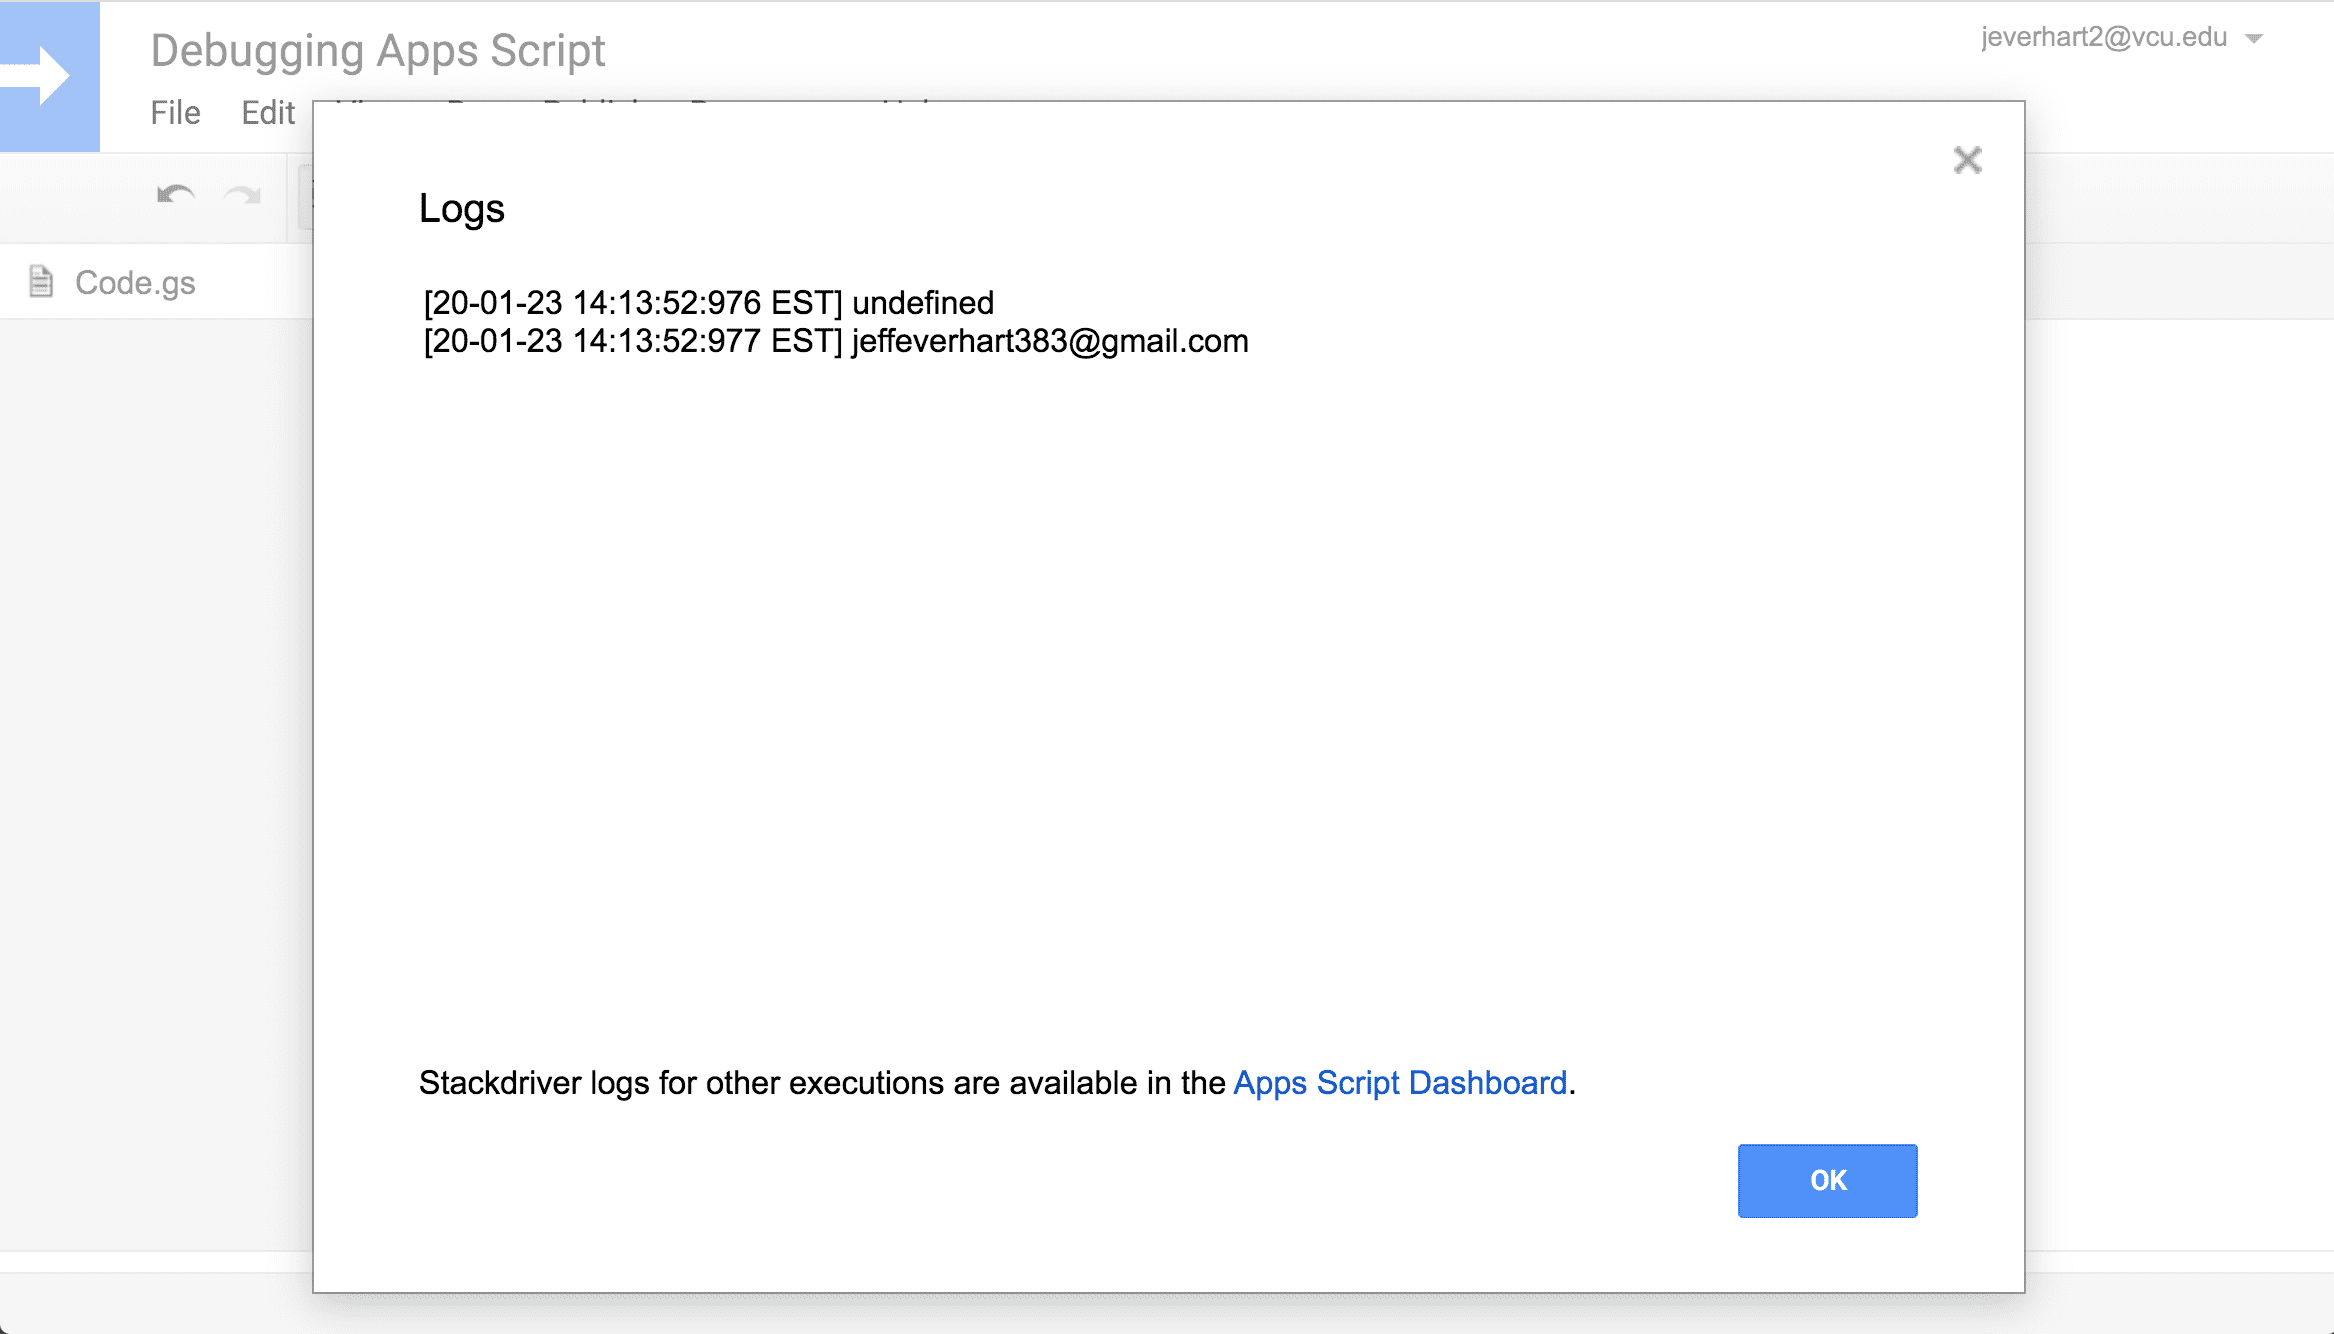
From this, we get some useful information that tells us one of the object properties, person.contact.email, is actually undefined at this point in our script. This should give us some additional information that we can use to address the problems causing the error. Logging can be a useful tactic in the debugging process, but we can also talk about the interactive debugger built into the Google Apps Script code editor.
Using the Interactive Debugger
The debugger is a built-in part of the Google Apps Script programming environment, and you can typically find debuggers built into the most popular IDEs and web browsers. Using the debugger allows us to move one step beyond logging, or trace debugging, and examine our script as it executes and control the flow of the program.
To activate this feature, we first set a breakpoint somewhere in our code where we want the debugger to halt the flow of the program so that we can examine the current context. To do that, you can click in the gutter space next to a line number in the code editor. 
You will know this worked when you see little red circles next to the line numbers.
Once we have a few breakpoints set, we trigger the debugger using the debug icon in the tool bar along the top of the code editor. Running debug mode will create some additional options in the menu that allow you to navigate the code by either resuming its progression using the “play” button, or stepping through the code line by line using some of the other buttons to the right.
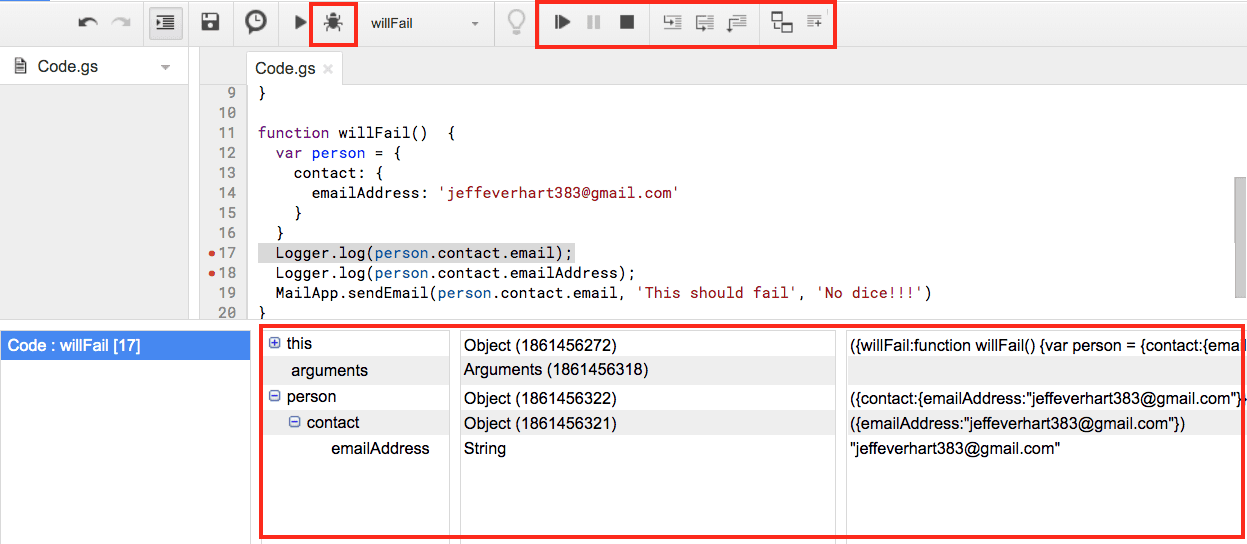
Toward the bottom you can see all of the variables available in the scope of the breakpoint available for inspection. Effectively using the debugger could be an entire post on its own, so I won’t expound too much on its usage here. However, even basic knowledge of how to use the debugger can be helpful, and setting a few breakpoints and hitting the play button to advance to the next breakpoint can help illustrate how variables change during the execution of your script.
Wrapping Up
In this post we’ve looked at a number of different strategies and tools you can use to debug projects in Google Apps Script. Some of them, like failure notifications and Stackdriver logs, are tools available in Apps Script to help us gain insight into the nature of an error, others, like logging and debugging, are useful strategies that developers use in many other programming contexts.
Thank you for a great tutorial. I have developed an appscript project to generate google doc and e mail attachment from google form. It’s working fine. The only problem I am having trouble is the duplicate records and spreadsheet and doc and e mail is generated without submitting the form again. Can you please send a link to a tutorial which address this issue?
Can you elaborate on this issue? I’m not sure I understand what is going wrong.
Did you have to do anything special to get the debugger to show the details of your object as your code runs/at each checkpoint? Mine just shows “undefined” or “object” once the variable has actually been set.
No, you shouldn’t have to do anything special. If you look at the screenshot where I use the debugger, there is pane on the right where the values of the object are displayed. What do you see in that pane and what do your objects look like?