For those of you who’ve read the blog for any amount of time, you’re likely already aware of my tendency to skew towards data and data-driven solutions to problems. Thus, I tend to talk with people about using data for a lot of different purposes, conversations that have illuminated the ways in which data can help along with the enumerable ways that we let the quest for data actually obscure our greater purpose. 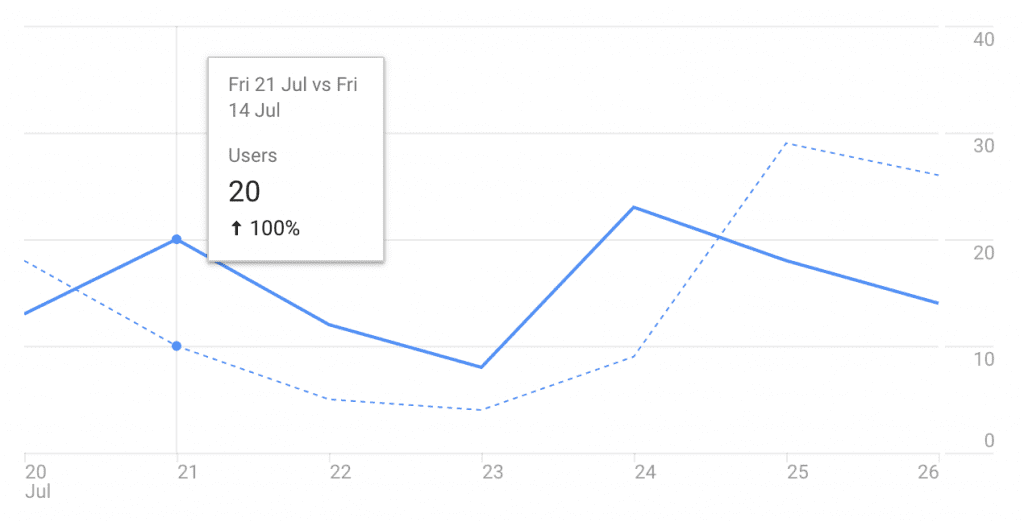
I’m going to refer to these statistical diversions as shadow metrics from here on out, both to distinguish them from the types of beneficial metrics we should be tracking but also to highlight their subversive nature to the overall analytic process.
What are some examples of popular shadow metrics?
Over the years, I’ve had the chance to collect examples of shadow metrics from a variety of different industries, mostly related to technology. Since I’ve got a lot of examples that I want to explain in detail, I’m going to do a series of posts on the subject.
Example 1: Tracking the Gateway
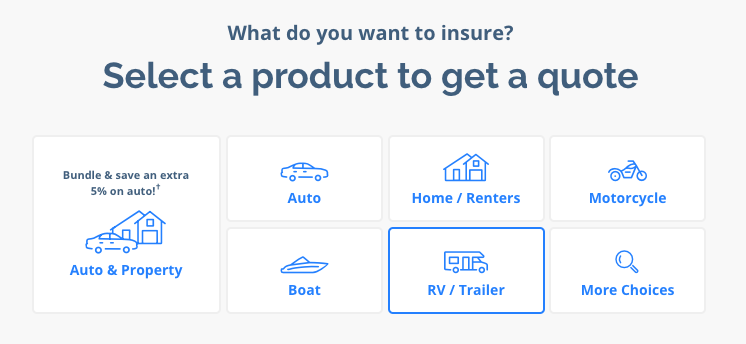
For example, while working as a web developer at an insurance company, I participated in a long conversation about how we should group and present different combinations of insurance policies in a dropdown menu. Our main debate focused on whether or not we should present combinations of policies (Auto & Home) or just let them select individual policies from the list, and then, if we were going to present combinations, which combinations should be used.
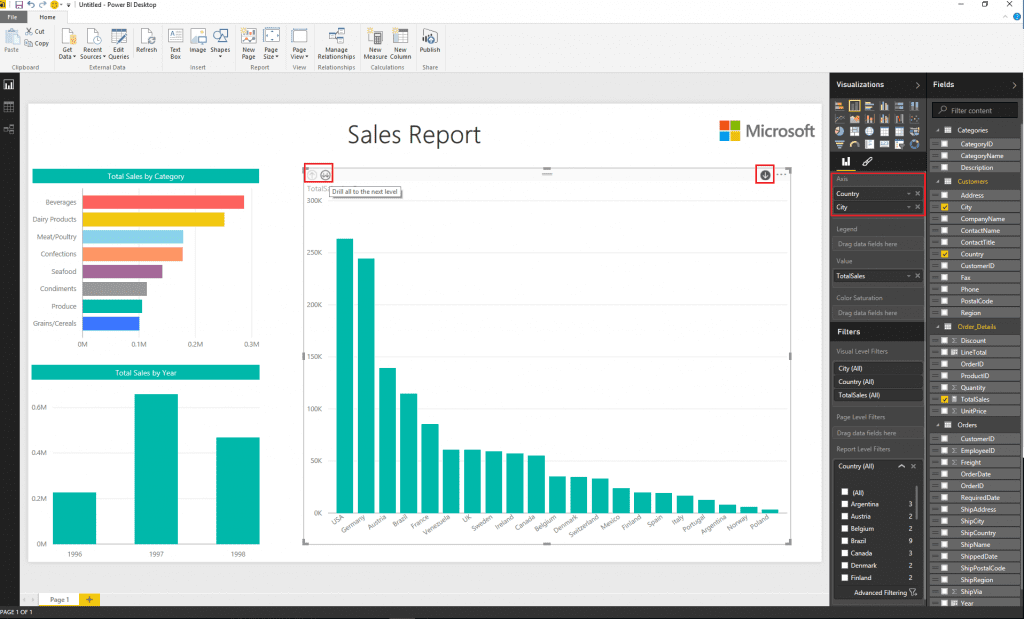
Needing to anchor the conversation to some reality, we turned to the data we had available. Since all form submissions were stored in a database, we could see a neat bar graph in a BI tool of how many quotes of each type had been submitted, the most popular days and times for quote submission, and even a geographical breakdown of our most popular areas.
All of this seemed like great data, but the one thing we were missing was the percentage of these quotes that actually turned into written policies, or in other words, our conversion rate farther down the sales funnel.
We could estimate the percentage of people who might fill out the request form, but had no idea what percentage of people where then converted into paying customers.
When developing technological systems that augment other types of business or services, we have a tendency to focus heavily on what I’d like to call gateway tracking. Since developers and IT professional are really only responsible for this step, the form submission, we forget the other steps in the chain that also have an impact on profitability. Since we can control the copy around the form or the options in a select menu, we tend to track and optimize for that.
Mostly, we want to say “Hey, we did this thing, and here is the quantifiable result.”
While this is a helpful notion, we need to make sure the metrics we are optimizing for are actually the metrics that will help the bottom line. Most of you are thinking, well of course, but if we increase form submissions, the agents will have more leads.
That is, of course, true, but more leads does not always mean more business. For example, let’s assume we make the best form ever, increase the ease of submission, and get more submission from people outside of our target personas. Now the agents are inundated with lots of lower quality leads, which could in theory lead to lower sales even though we increased our number of leads.
If we imagine our goal as selling policies instead of collecting form submissions, all of the sudden the nature of our analytics needs to change as well.