Over the last several years, it seems like I’ve worked on a lot of different map-based applications for a variety of purposes. Some of them have been focused on the digital humanities, like the Moton Museum Civil Rights Tour, while other have been more business-oriented, like this one that I started while at VAFB.
I’m not sure whether these projects sparked an interest in understanding more about geographic data, or whether an underlying interest in geographic data lead me to volunteer to work on such projects. Either way, this is a subject area I’ve since doubled down on, taking some additional grad classes at VCU in GIS, and try to incorporate more into the work that I do at ALT Lab whenever possible.
Before I got here, Tom had worked with some folk before to use WordPress sites as ways to collect and analyze geographic data of varying types. Since there are multiple disciplinary uses for these types of tools, we decided to take these patterns and build them into a more robust theme that we can deploy with little configuration.
As is most of our stuff, this is currently a work in progress, but you can find the code here if you are so inclined. I’ll talk about some of the more interesting pieces below:
Collecting Data and Analyzing the ‘Real’ World
At VCU, we work with lots of faculty on ways to get students out into the community to analyze and apply the theories or concepts they are studying in their courses. Thus, at the heart of this tool, we give students and faculty a way to collect geographic data, essentially latitude and longitude points, and associate them with additional media or analysis.
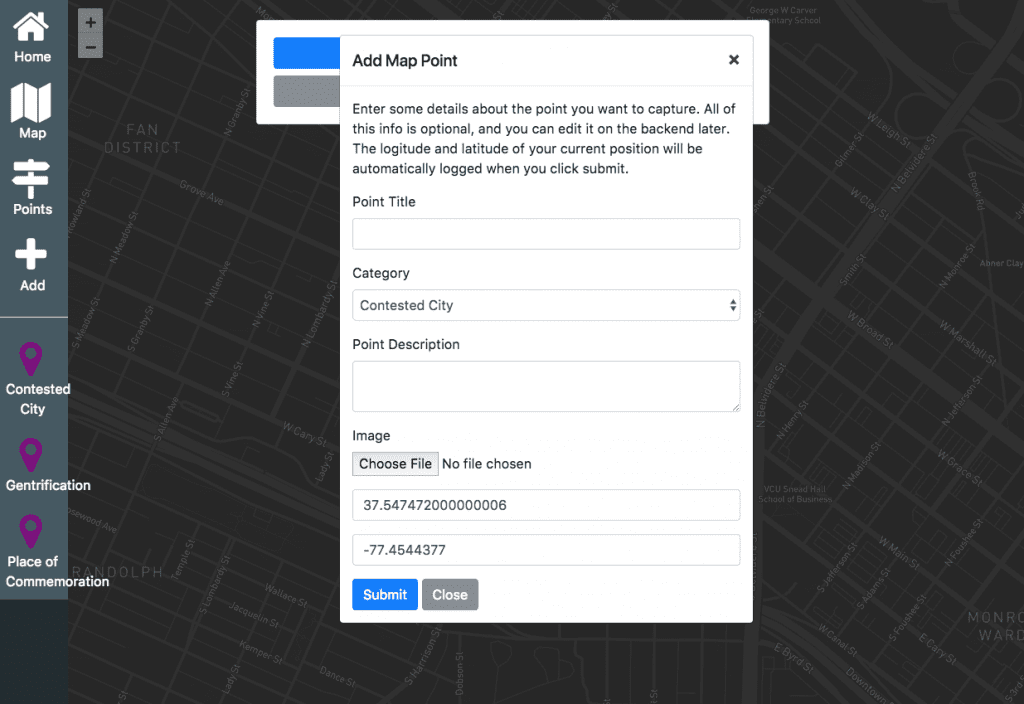
The theme leverages the geolocation features on the browsers to locate the students and populate fields for lat/long position. From here the students can categorize their map point based on what the faculty member makes available, which helps later with different types of filtering.
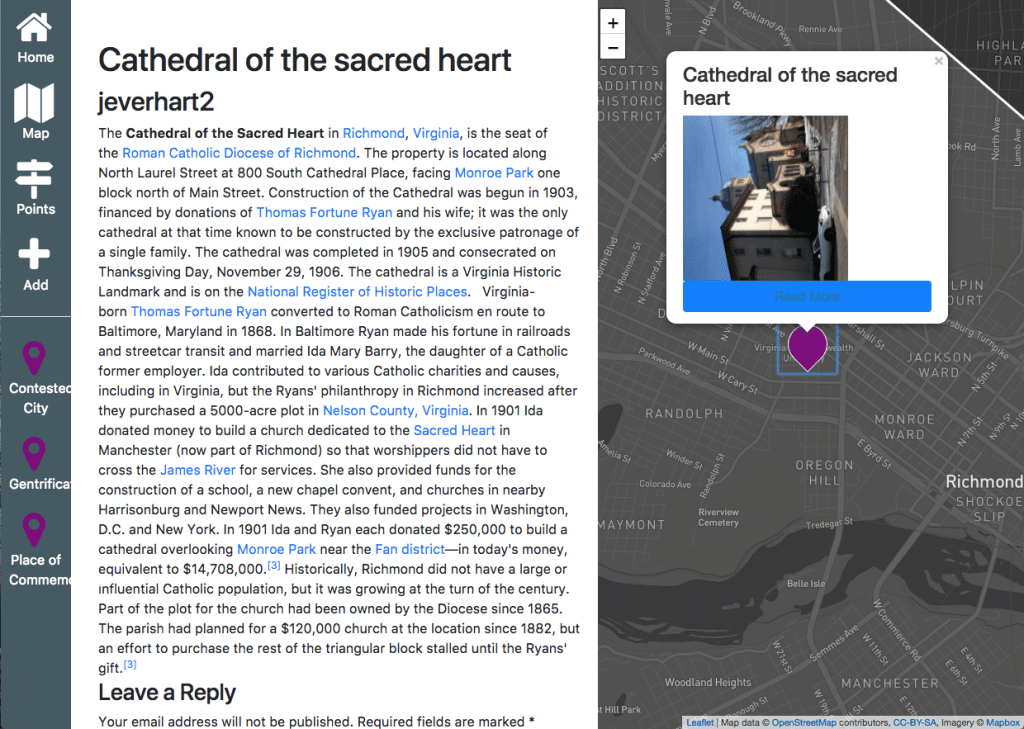
This form creates a post using the ‘Map Point’ post type, which the students can then access and edit later with fleshed out descriptions or research on the particular place. So, in terms of workflow, the students can capture a map point on their mobile device, than resume their exposition on a larger device when they are ready to do so.
Overall, I think this type of pattern will result in some cool projects that hopefully get students ready to apply different concepts as they explore their physical environment.
Another cool benefit of this project is that we’re in the beginning stages of creating a web GIS tool using the WordPress platform. With the framework in place, it would be pretty trivial to add/remove additional form fields to the point submission form depending on what type of data you are collecting.
Visualizing Geographic Data
As we start to collect more interesting geographic data, we can also start to visualize it in different and interesting ways. We’re all pretty familiar with the idea of indicating a point in 2D space with a map icon, but at times that can get cluttered and be deceiving visually as icons overlap. A lot of this depends on the scale of the map, which can be a controlled variable in most web mapping solutions (Leaflet, Google Maps, etc.), but is still worth considering.

For example, how many points are here? We assume 4, but that may not be true as we adjust the scale of the map dynamically.
While the point is great to indicate a point in 2D space, they are not great at surfacing patterns or displaying any additional continuous variable, such as intensity or temperature. One method of visualizing that type of data is using a heat map.
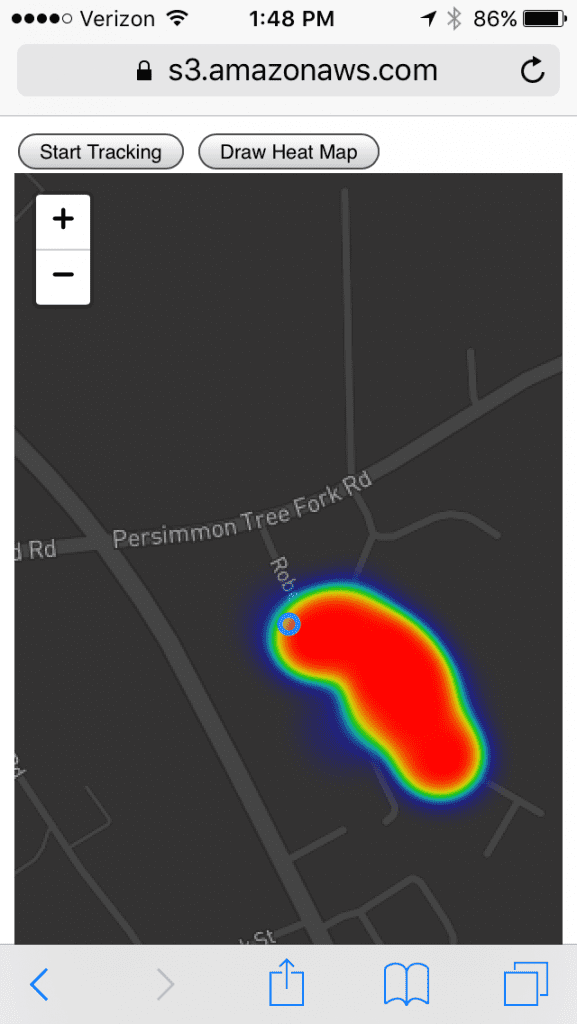
I haven’t dug into the code for this heat map Leaflet plugin a ton, but it does a good job of quickly taking some geographic coordinates and producing a nice-looking heat map. At present, I’m just piping whatever coordinates the browser returns into the heat map, but that might cause some issues down the road.
For example, each latitude and longitude point is stored in decimal degree format, so something like 76.9875433454, with each decimal getting more and more accurate.
This example, which you can interact with here, paints a nice heat map, but it also collects points every second or so as you walk, so it generally amounts to a lot of data. There will be some exploration necessary when we start dealing with student submitted points, since there will likely be a lot more space in between them, that might impact how the heat map represents intensity.
Here is the code for just the heat map piece if anyone is interested. It uses this Leaflet Heatmap plugin:
var heatmapCoords = [];
var mymap = L.map('map').setView([37.5536111, -77.4605556], 14);
L.tileLayer('https://api.mapbox.com/styles/v1/jeffeverhart383/cj9sxi40c2g3s2skby2y6h8jh/tiles/256/{z}/{x}/{y}?access_token=ACCESS_TOKEN_HERE', {
attribution: 'Map data © <a href="http://openstreetmap.org">OpenStreetMap</a> contributors, <a href="http://creativecommons.org/licenses/by-sa/2.0/">CC-BY-SA</a>, Imagery © <a href="http://mapbox.com">Mapbox</a>',
maxZoom: 18,
id: 'mapbox.streets',
accessToken: 'ACCESS_TOKEN_HERE'
}).addTo(mymap);
function startGeolocation (){
mymap.locate({ watch: true, enableHighAccuracy: true, setView: true, maxZoom: 16 });
}
var userPositionCircle = L.circle([37.5536111, -77.4605556] ).addTo(mymap);
function drawHeatmap () {
L.heatLayer(heatmapCoords).addTo(mymap);
console.log('drawn heatmap')
}
function displayCoords () {
document.querySelector('#coords').innerHTML = heatmapCoords
}
function onLocationFound (e) {
userPositionCircle.setLatLng([e.latitude, e.longitude]);
heatmapCoords.push([e.latitude, e.longitude])
displayCoords()
}
mymap.on('locationfound', onLocationFound);
var button = document.querySelector('#startGeolocation')
button.addEventListener('click', function (){
// console.log('clicked');
startGeolocation();
})
var heatmapButton = document.querySelector('#drawHeatmap')
heatmapButton.addEventListener('click', function (){
console.log('heatmap clicked');
drawHeatmap()
})