I’m not really sure when this happened, but over the last several years, I’ve started to spend a lot of my personal and professional time working on building out data visualization tools and workflows. In a recent meeting, someone referred to us as data scientists, and we’ve had a good running joke ever since. While I appreciate the nod, I’m not sure I’m ready to self-refer to myself as that. As most self-taught people in tech know, it takes awhile to really feel comfortable calling yourself a title that you don’t really think you deserve, having stumbled backwards or perhaps half-blind into your present skill set.
Either way, as someone good with data stuff (SQL, web dev, dashboards, data viz, and Python), I’m increasingly being asked to provide advice as some sort of subject matter expert on the tools in the modern data toolkit.
While this is a lot of fun, it really starts to make me think about my own practices, which are admittedly ever evolving and self-serving. On a recent project, I was asked to advise a professor in the Information Systems department teaching a Business Intelligence class for the Online MBA at VCU. He has a pretty ambitious goal: get MBA students to conduct basic BI/data analysis tasks using tools available in AWS.
Below are just a few of my thoughts on using some of the tools available in AWS.
AWS Athena: Who Needs a Stinking Database
One of the first tools I started looking at was AWS Athena. This is a very cool service that simplifies a lot of things for anyone looking to work with data. In most cases, if you have more than one spreadsheet of data to analyze, or want to do some advanced querying, you will want to load you data into one or more SQL tables using some SQL variant.
Basically, there are a few ways to get data from one source, say a CSV, into a SQL database. Some of the ways I’ve done this in the past involve either loading the CSV files using a database management tool, or script the same thing with Python. As an example, for my IPEDS data analysis, I spent tons of upfront time importing CSV data to create my initial SQL tables. Some of these tables have 200K+ rows, so as you can imagine, that process took some time and was not without error.
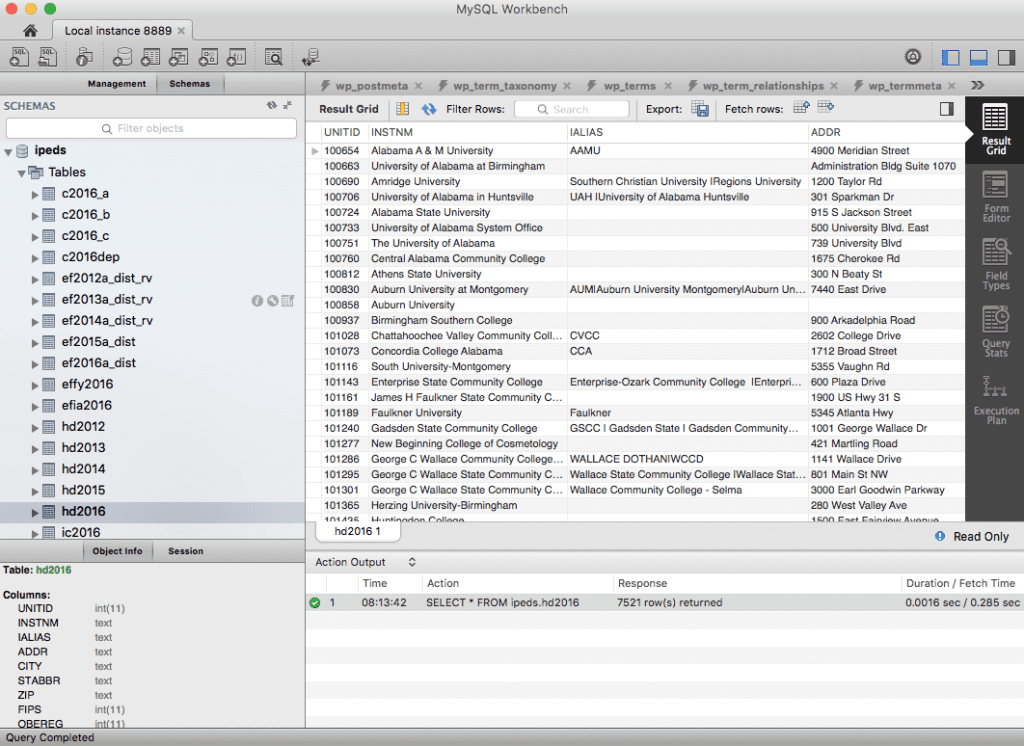
While this was clearly the best path, CSV -> SQL, it took an unnecessarily long time considering all I wanted to do was run few queries, then export the resultant data as JSON for use elsewhere. This is where Athena comes in handy.
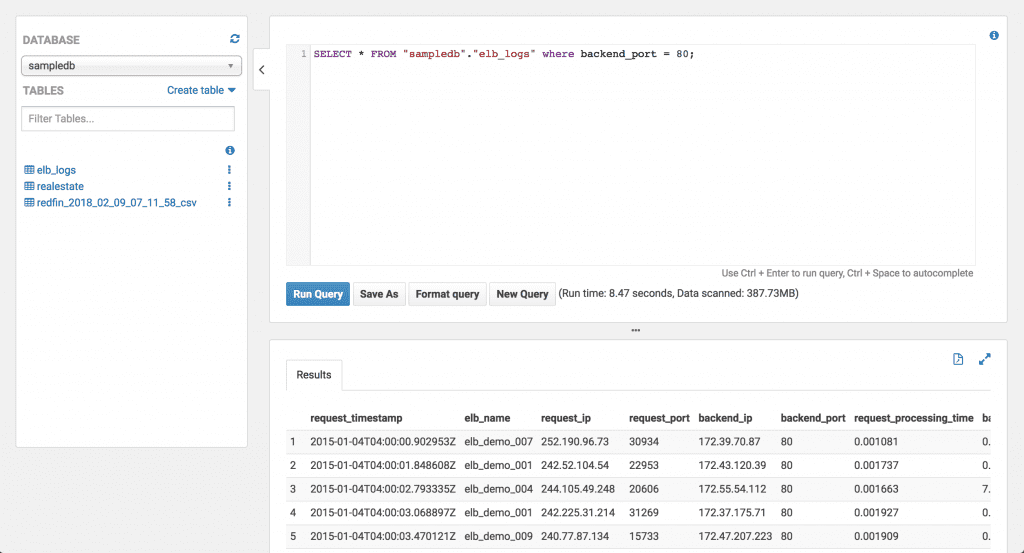
Athena allows you to upload your data to S3, then create ‘virtual’ databases and tables from that structured data (CSV, TXT, JSON). From there you can use an interface, or I’m assuming an API as well, to run queries against that data directly from S3.
Full blown databases are great at providing read/write access, while also giving you access to more advanced querying tools. But if you are working with a static dataset like I am in the IPEDS project, I’m not really reaping any of the benefits of the database, aside from the SQL querying.
At the same time, AWS’ provisioned database service is really expensive, like almost 2X the cost of a virtual server from the same specs. And the cost of those is calculated in hours, not just the time spent querying or writing data. Athena on the other hand, only charges you for the queries you run, which would make it a more cost effective choice for organizations that have large amounts of data.
Needless to say, I’m going to shift some of my own projects over to using this technology, especially when I’m sure I won’t need to continue to write data to tables. For just loading and transforming the data, it seems like Athena is the way to go.
AWS Quicksight: Why Do I Even Program?
Over the last few years, I’ve built out a number of dashboards manually using some variant of D3 or other charting libraries. However, the more time I spend with data folks, the more and more I question whether or not ‘bespoke’ dashboards written in JavaScript are the way to go.
Technology has a funny way of making hard things trivial over time, and I think we’re about there with modern “business intelligence” tools like Tableau, Power BI, and Quicksight.
Sticking with my theme of AWS for most things, I decided to give Quicksight a try. Since I just wanted to build out some basic examples, I downloaded a quick CSV file of active real estate listings in Richmond, VA from Redfin.
Real estate tends to be a nice domain for test data sets since there are tons of variables to look at, the data sources are plentiful, and it is easy to understand.
Overall, my experience using Quicksight to build out a dashboard was pretty excellent, and I was able to use a nice drag and drop interface to design my visuals.
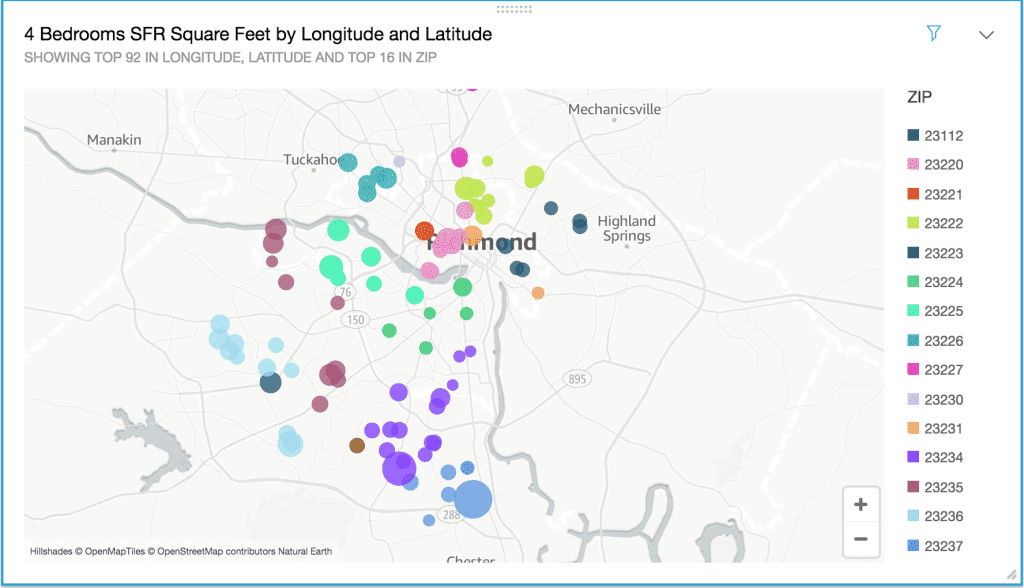
At a high level, Quicksight handles data like a boss. It does a great job of inferring the types of data from your source. Without coercion, it picked up the geospatial components of my data set, along with the other numerical and textual data.

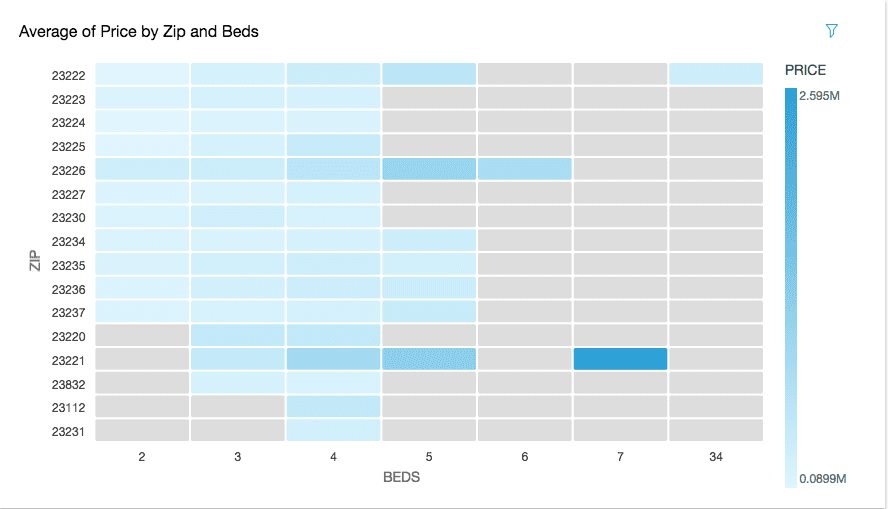
Again, it impressed me with the breadth of available visual models, and the ease with which I could construct them. For most of the visuals, such as this heat map, I’ve built an equivalent chart type somewhere in JavaScript. While I was a bit disappointed in my ability to customize the display of the different charts, I was impressed with how easy there were to create.
It seems like Quicksight, and I’m sure to a greater extent Tableau, are trying to strike a balance between ease of use and customization. It appears there is only so much I can do to make things look better, but there is only so much visual harm I can do as well.
In the end, I really liked using Quicksight, and it made me take a second to question when a tool like this is a better choice over some sort of web dashboard. However, Quicksight is built around the idea of an ‘account’ with users, and does not appear to have an easy way to publish these visuals to the public web, which for my work is a huge downside. I think this is where Tableau might have an edge with their public gallery or paid hosting.
1 thought on “Using AWS for Data Analysis”